Clean Air Home Services
Know Your Air · Powered by Aeritas
Indoor air & your lungs · Florida edition

The air inside your home may quietly be making you sicker.

The EPA has estimated for decades that indoor air is 2–5× more polluted than outdoor air — and in Florida, year-round humidity and constant AC use turn your HVAC system into a highway that carries whatever is in it into every room.1

This is a calm, source-cited guide to what the science actually says — and how existing conditions like asthma and COPD can be quietly amplified by the air you breathe eight hours a night.

Sources from EPA, ALA, WHO, CDC
Not medical advice
Bright modern Florida living room with a family relaxing on the sofa
Healthy air, visualized
EPA
90%
of the average American’s time is spent indoors.1
2–5×
More polluted indoors than out1
~50,000
Est. US premature deaths/yr from PM2.52
~21,000
US lung-cancer deaths/yr linked to radon3
40–55%
The indoor humidity band that reduces mold risk4
Who we are

Not just HVAC. Indoor air quality experts.

Clean Air Home Services is a Florida-based team of licensed HVAC technicians, mold assessors, and remediation professionals. We’ve worked on over 2,000 homes across the state — and we don’t just fix what’s broken. We diagnose what’s actually making the air feel wrong, then give you a plan to fix it.

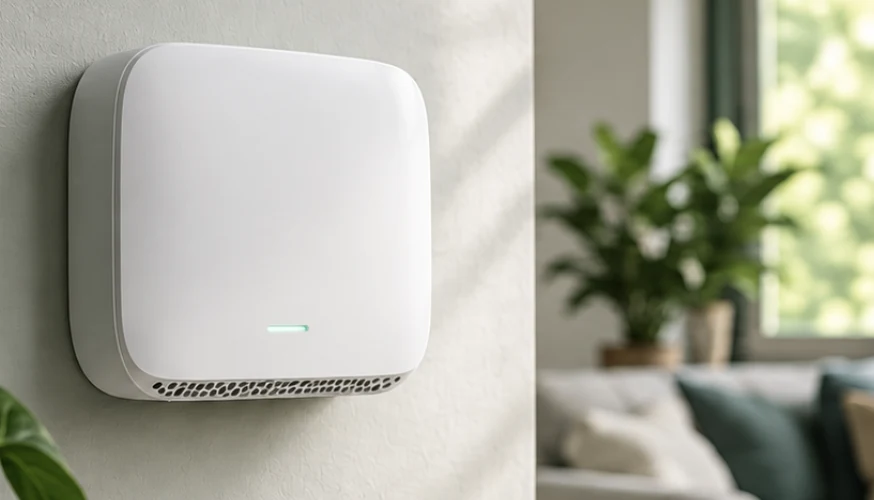
For homeowners who want to stay ahead of problems, we also install a continuous monitoring system, powered by Aeritas, that alerts you when something starts to trend the wrong way — long before it becomes an expensive fix.

What’s included
Licensed mold assessors

In Florida, assessors are legally separate from remediators — we hold both licenses, so the diagnosis stays honest.

2,000+ Florida homes

Across South, Central, North, Panhandle, and Southwest Florida — every climate quirk this state has, we’ve worked in.

HVAC-certified techs

Most HVAC issues aren’t “you need a new system.” It’s a capacitor, a low charge, a clogged drain line, or a system that needs a real cleaning.

Continuous monitoring, optional

For homeowners who want early warnings before things become expensive: an Aeritas-powered sensor and annual membership.

Why people call us

Three reasons homeowners pick up the phone.

Almost every call falls into one of these three. If any of them sound like your house, an assessment usually saves you money — not costs you more.

Something feels wrong

“I think there’s mold. Someone in the house keeps getting sick.”

Kids with new coughs, an older parent who feels worse indoors than out, headaches you can’t explain — sometimes even a dog that’s off. When multiple bodies in the same house are telling you the same thing, the air is usually where to start.

We look for: moisture, mold, HVAC contamination, and elevated particulate or VOC signals.
HVAC symptoms

“My system isn’t cooling right. I’m being told I need a new one.”

Most of the time, you don’t need a new system. You need a real cleaning, a new capacitor, a Freon top-up, or a clogged drain line cleared. We’ll tell you honestly which one — and we’ll show you why.

We look for: coil and drain-line condition, refrigerant charge, capacitor health, airflow, and zoning issues.
Prevention

“I want to know before it’s a problem.”

A one-time assessment plus optional continuous monitoring means we tell you the moment humidity, particulates, or HVAC behavior start trending the wrong way — while it’s still a small fix, before it turns into an expensive one.

Included with membership: Aeritas monitor, alerts, seasonal check-ins, priority scheduling.
Section 01 · How the mechanism works

Your HVAC system doesn’t just cool the house. It distributes what’s living inside it.

In humid climates, cool evaporator coils condense moisture out of the air every cycle. Combined with dust caught in a saturated filter and constant recirculation, that creates the conditions where biofilm and mold can grow — and where fine particles get carried, room to room, for hours a day.5

Cross-section diagram of a residential HVAC air handler showing filter, evaporator coil with condensation, blower, and supply ducts distributing particles to rooms
Illustrative diagram. Return air passes the filter and cooling coil, then recirculates through supply ducts — dust, moisture, and any biological growth ride along.
1
Condensation on the coil

Every cooling cycle pulls moisture from the air. If drainage or drying is compromised, that damp surface is where problems begin.

2
Dust as fuel

Filters that are undersized or overdue trap organic dust on wet metal — the substrate mold and bacteria need to establish.

3
Recirculation, room to room

Fine particles and spores don’t stay put. They’re pushed through supply ducts into bedrooms, offices, and nurseries — often for eight hours a night.

Why Florida

Humid climate + year-round AC changes the math.

Long condensation season
Coils and drain pans stay wet for months at a time. When drying windows shrink, biological activity has more time to establish.5
Oversized, short-cycling systems
Common in the Southeast. Short cycles cool the house but never dehumidify it — indoor RH stays high, and mold risk climbs above ~60% RH.4
Closed-window living
In Florida heat, homes are sealed against the outdoors. Whatever is generated indoors accumulates rather than diluting.1
Radon isn’t just a “northern” issue
Radon varies house by house, not just region by region. The EPA recommends every home be tested.3
Section 02 · What the evidence says

For most people, indoor air is background noise. For anyone with an existing condition, it’s an amplifier.

The health evidence on indoor exposures is now robust across mold, particulates, radon, and VOCs. The consistent finding is not that clean air causes new disease overnight — it’s that poor indoor air amplifies existing conditions and raises long-term risk.2

Illustration of a torso silhouette with highlighted lungs and HVAC particle icons
Asthma

A trigger stack, not a single cause.

Mold, dust mite allergen, cockroach allergen, and fine particulate matter are all recognized asthma triggers — each linked to more symptoms, more rescue-inhaler use, and more ED visits.6

Amplification: more frequent and more severe attacks in already-diagnosed people.

COPD

Fine particles accelerate decline.

Long-term exposure to PM2.5 is associated with worse lung-function trajectories and more frequent exacerbations in COPD populations — and epidemiology finds no safe threshold.2

Amplification: faster progression, more flare-ups, more hospital days.

Long-term risk

Radon & PM: quiet, cumulative.

The EPA identifies radon as the second-leading cause of lung cancer in the US, and the leading cause among people who’ve never smoked. Long-term PM2.5 exposure is also independently associated with lung-cancer mortality.3,2

Amplification: stacked lifetime dose — small daily exposures over decades.

Broader effects

Allergies, cognition, cardiovascular.

Dampness and mold are consistently associated with upper-respiratory symptoms and allergic sensitization. Elevated CO2 and VOCs are associated with reduced cognitive performance and headaches. Long-term PM exposure is linked to cardiovascular events.7

Amplification: sinus, sleep, focus, and heart risk in vulnerable groups.

A note on language: “associated with” and “amplifies” are used deliberately. This site does not diagnose, and the presence of any indoor exposure does not mean disease is certain — it means the risk is higher than most people realize.

Eye-opening insights

What most homeowners never realize.

Six findings from EPA, WHO, and peer-reviewed studies that reshape how most people think about the air in their own home. None of these are visible. All of them are measurable.

Diagram showing PM10, PM2.5, and ultrafine PM0.1 particles and how each penetrates deeper into the respiratory system
Ultrafines

Cooking dinner can produce 10× more ultrafine particles than baseline — and most monitors don’t see them.

Frying and gas-stove cooking produce billions of particles smaller than 0.1 µm — below the size cutoff of PM2.5 regulations, but small enough to reach the deepest alveoli where gas exchange happens.9

Why continuous matters: ultrafine events peak for 30–60 minutes and then vanish. A one-time inspection can’t catch them — longitudinal monitoring can.

Side-by-side illustration of an adult in teal and a child in coral, showing that children inhale a larger proportional volume of air per pound of body weight
Children

Children breathe about 50% more air per pound of body weight than adults.

Per EPA, this is why the same room, at the same air quality, delivers a proportionally higher dose to a five-year-old than to a parent. Developing lungs and immune systems compound the effect.10

Why continuous matters: kids’ bedrooms — where they spend the most hours — are rarely the room most homeowners think to inspect first. Monitoring changes that.

Cognition

Cognitive scores were 61% higher on low-VOC days.

A Harvard T.H. Chan controlled-exposure trial found VOCs and CO2 were independently associated with lower cognitive-function scores across all nine domains tested.8

Why continuous matters: CO2 and VOCs swing hour by hour. You can’t manage what you don’t measure.

Hidden mold

Most household mold isn’t on the wall.

EPA and WHO note mold thrives in unlit, damp cavities: coil pans, ducts, wall assemblies, and under flooring. Spores can circulate without any visible surface growth.5,7

Why continuous matters: humidity trends show up before visible growth — often by weeks.

Florida radon

Florida homes are not radon-free.

Multiple Florida counties fall in EPA’s moderate-potential zone. EPA says every home should be tested regardless of zone — indoor levels vary house-by-house.11

Why continuous matters: radon is odorless and varies by season. A single test can miss it.

Time indoors

You’ll spend ~22 years of your life in one bedroom.

Americans spend ~90% of their time indoors, per EPA — a third of that asleep in one room. Whatever exposure is in that room is delivered on repeat, for decades.1

Why continuous matters: the room with the highest cumulative dose is rarely the one tested first.

The common thread

Each of these facts describes something invisible, intermittent, or long-tail — the exact conditions a one-time inspection is designed to miss.

A licensed IAQ assessment tells you what your air is doing today. Continuous monitoring, layered on top, tells you what it does at 2 a.m. after a humid week, or when someone cooks with the range hood off, or when the AC coil starts to sweat differently. That’s the layer Aeritas adds to professional service.

Section 03 · The data, from the primary sources

The numbers most homeowners have never seen.

Each figure below is drawn from an authoritative source and linked in the references. We hedge where the science hedges.

2–5×
Indoor concentrations of many pollutants vs. typical outdoor levels, per EPA. Occasionally 100× higher during activities like painting.
EPA · Report on the Environment1
~50k
Estimated US premature deaths per year attributed to PM2.5. Cardiovascular and respiratory effects dominate.
American Lung Association · State of the Air2
~21k
Estimated US lung-cancer deaths per year associated with radon exposure. #1 cause of lung cancer in non-smokers.
EPA · Health Risk of Radon3
90%
Share of an average American’s time spent indoors, per EPA — where exposures are usually higher, not lower.
EPA · Indoor Air Quality1
30–50%
EPA-recommended indoor relative-humidity range. Above ~60% RH, mold-growth risk rises meaningfully in humid climates.
EPA · Mold and Moisture4
Damp
WHO concluded there is sufficient evidence of a link between indoor dampness/mold and respiratory symptoms, asthma exacerbation, and current asthma.
WHO Guidelines · Dampness & Mould7
Section 04 · What you can actually do

Three steps, in order. Skip none of them.

The evidence-based sequence is straightforward. It’s the same order the EPA recommends: source control → ventilation → filtration, wrapped in continuous measurement so you actually know whether what you did worked.1

1
Inspect

Get a real, licensed IAQ & HVAC assessment.

A one-time diagnostic across the coil, drain pan, ducts, filters, humidity behavior, and any suspected mold sources. In Florida, a licensed mold assessor is separate from a remediator by law — a feature, not a bug.

Result: a written baseline. What’s good, what needs fixing, what needs monitoring.
2
Monitor

Continuous, multi-sensor monitoring.

One-time snapshots miss the pattern. Aeritas-powered monitoring tracks PM2.5, PM10, CO2, TVOC, humidity, and temperature over time, correlates them with your HVAC cycles, and produces doctor-friendly summaries you can share.

Result: longitudinal evidence, not guesswork.
3
Fix & verify

Targeted remediation and HVAC upgrades.

In order: source and moisture control, humidity management, high-efficiency (MERV 13+) filtration with proper airflow, coil cleaning, and where indicated, coil-mounted UV-C. Verify with post-intervention monitoring.

Result: measured improvement, not just a fresh service sticker.
Field notes · from real Florida homes

What we actually see in the field.

Photos, videos, and plain-English context from licensed technicians working Florida homes — what we find inside air handlers, ducts, and crawl spaces, and what it means for the people living there.

What’s in an assessment

One hour. A real answer.

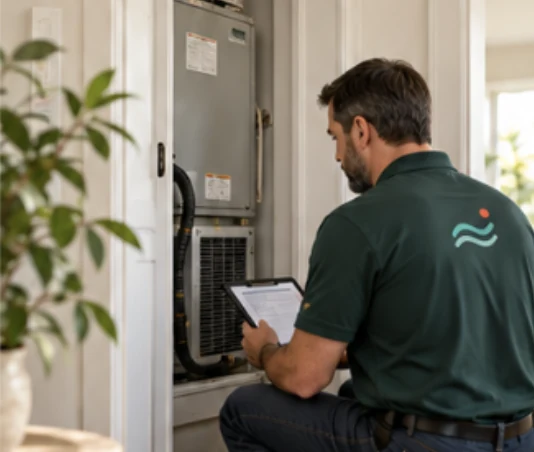
A licensed IAQ & HVAC technician comes to your home for about an hour. You get a written roadmap: what’s good, what to fix, what to monitor — and how urgent each one is.

Reschedule or cancel free up to 24 hours before. Serving Florida statewide.
  1. 1
    Air sample
    We take a lab-grade air sample to check for mold spores, particulate load, and biological signals.
  2. 2
    HVAC inspection
    Coil, drain pan, filter, blower, refrigerant, capacitor, airflow. We find what’s actually wrong — usually it’s cheaper than replacing the system.
  3. 3
    Zone-by-zone temperature check
    Some rooms are always hotter, colder, or muggier. We measure each zone so you know whether it’s the ductwork, the thermostat, or the system itself.
  4. 4
    Particle counts & monitoring readings
    Real-time PM2.5, PM10, humidity, temperature, and VOC readings from our field instruments — baseline data you can compare against after any fix.
  5. 5
    Interview & roadmap
    We sit with you, understand the symptoms and history, and hand you a prioritized plan: what to fix now, what to watch, and whether ongoing monitoring makes sense for your home.
References

Every claim on this page, linked to its source.

  1. 1. US EPA. Indoor Air Quality (Report on the Environment) and Indoor Air Quality Backgrounder. Indoor pollutant levels are commonly 2–5× higher than outdoor, and Americans spend ~90% of time indoors. epa.gov/report-environment/indoor-air-quality
  2. 2. American Lung Association. State of the Air 2025. Estimated ~50,000 US premature deaths per year attributable to PM2.5; long-term exposure associated with cardiovascular, respiratory, and lung-cancer mortality. lung.org/research/sota/health-risks
  3. 3. US EPA. Health Risk of Radon. Radon is the second-leading cause of lung cancer in the US and the leading cause among non-smokers, associated with ~21,000 lung-cancer deaths per year. epa.gov/radon/health-risk-radon
  4. 4. US EPA. Mold and Moisture — Indoor Air Quality. Recommended indoor RH range of 30–50%, with elevated mold-growth risk as RH climbs. epa.gov/mold
  5. 5. US EPA. Mold Course and Should You Have the Air Ducts in Your Home Cleaned?. Guidance on moisture, HVAC components, and biological growth in residential systems. epa.gov/mold/mold-course-chapter-1
  6. 6. US EPA. Asthma Triggers: Gain Control. Common indoor asthma triggers include mold, dust mites, cockroach and pet allergen, secondhand smoke, and combustion pollutants. epa.gov/asthma/asthma-triggers-gain-control
  7. 7. World Health Organization. WHO Guidelines for Indoor Air Quality: Dampness and Mould. Sufficient epidemiological evidence linking indoor dampness/mold to respiratory symptoms, asthma exacerbation, and current asthma. who.int/publications
  8. 8. Allen JG, MacNaughton P, Satish U, et al. Associations of Cognitive Function Scores with Carbon Dioxide, Ventilation, and Volatile Organic Compound Exposures in Office Workers: A Controlled Exposure Study of Green and Conventional Office Environments. Environ Health Perspect. 2016;124(6):805–812. Cognitive scores 61% higher on green/low-VOC days and 101% higher with higher ventilation. pubmed.ncbi.nlm.nih.gov/26502459
  9. 9. Wallace L, Emmerich SJ, Howard-Reed C. Source Strengths of Ultrafine and Fine Particles Due to Cooking with a Gas Stove. Environ Sci Technol. 2004;38(8):2304–2311. Cooking produced >10× the ultrafine particle numbers seen at non-cooking baseline; more than 90% of particles were in the ultrafine (<0.1 µm) range. pubs.acs.org/doi/10.1021/es0306260
  10. 10. US EPA. Reference Guide to Indoor Air Quality in Schools and Why Indoor Air Quality is Important to Schools. Children are especially sensitive to air pollution because they breathe about 50% more air per pound of body weight than adults. epa.gov/iaq-schools/reference-guide-indoor-air-quality-schools
  11. 11. US EPA. Map of Radon Zones — Florida. EPA identifies moderate-potential (Zone 2) radon counties in Florida and states that the map is not a substitute for testing individual homes; every home should be tested regardless of zone. epa.gov/sites/default/files/2014-08/documents/florida.pdf
Important notice
This page is educational and does not provide medical advice, diagnosis, or treatment. Environmental measurements are not diagnostic of any medical condition. If you or someone in your household is experiencing symptoms, consult a licensed physician. If any monitor reports elevated carbon monoxide (CO), evacuate and call emergency services — do not troubleshoot.